Tradução e análise de palavras por inteligência artificial ChatGPT
Nesta página você pode obter uma análise detalhada de uma palavra ou frase, produzida usando a melhor tecnologia de inteligência artificial até o momento:
- como a palavra é usada
- frequência de uso
- é usado com mais frequência na fala oral ou escrita
- opções de tradução de palavras
- exemplos de uso (várias frases com tradução)
- etimologia
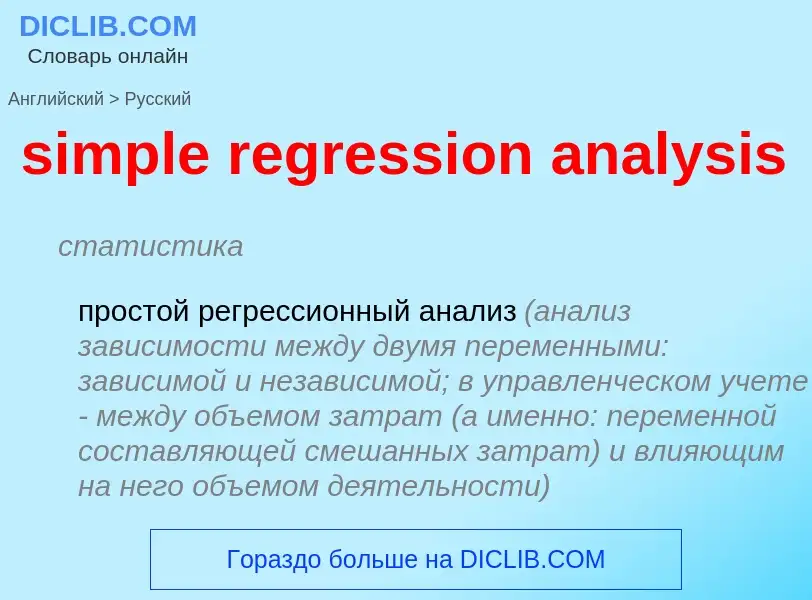
simple regression analysis - tradução para russo
статистика
простой регрессионный анализ (анализ зависимости между двумя переменными: зависимой и независимой; в управленческом учете - между объемом затрат (а именно: переменной составляющей смешанных затрат) и влияющим на него объемом деятельности)
общая лексика
анализ потребляемой мощности
проектируемой микросхемы
Смотрите также
Definição
Wikipédia
In statistics, simple linear regression is a linear regression model with a single explanatory variable. That is, it concerns two-dimensional sample points with one independent variable and one dependent variable (conventionally, the x and y coordinates in a Cartesian coordinate system) and finds a linear function (a non-vertical straight line) that, as accurately as possible, predicts the dependent variable values as a function of the independent variable. The adjective simple refers to the fact that the outcome variable is related to a single predictor.
It is common to make the additional stipulation that the ordinary least squares (OLS) method should be used: the accuracy of each predicted value is measured by its squared residual (vertical distance between the point of the data set and the fitted line), and the goal is to make the sum of these squared deviations as small as possible. Other regression methods that can be used in place of ordinary least squares include least absolute deviations (minimizing the sum of absolute values of residuals) and the Theil–Sen estimator (which chooses a line whose slope is the median of the slopes determined by pairs of sample points). Deming regression (total least squares) also finds a line that fits a set of two-dimensional sample points, but (unlike ordinary least squares, least absolute deviations, and median slope regression) it is not really an instance of simple linear regression, because it does not separate the coordinates into one dependent and one independent variable and could potentially return a vertical line as its fit.
The remainder of the article assumes an ordinary least squares regression. In this case, the slope of the fitted line is equal to the correlation between y and x corrected by the ratio of standard deviations of these variables. The intercept of the fitted line is such that the line passes through the center of mass (x, y) of the data points.

![squaring-only]] step, the right (broader) peak shows the multiplication step, allowing exponent bits 0 and 1 to be distinguished. squaring-only]] step, the right (broader) peak shows the multiplication step, allowing exponent bits 0 and 1 to be distinguished.](https://commons.wikimedia.org/wiki/Special:FilePath/Power attack full.png?width=200)

